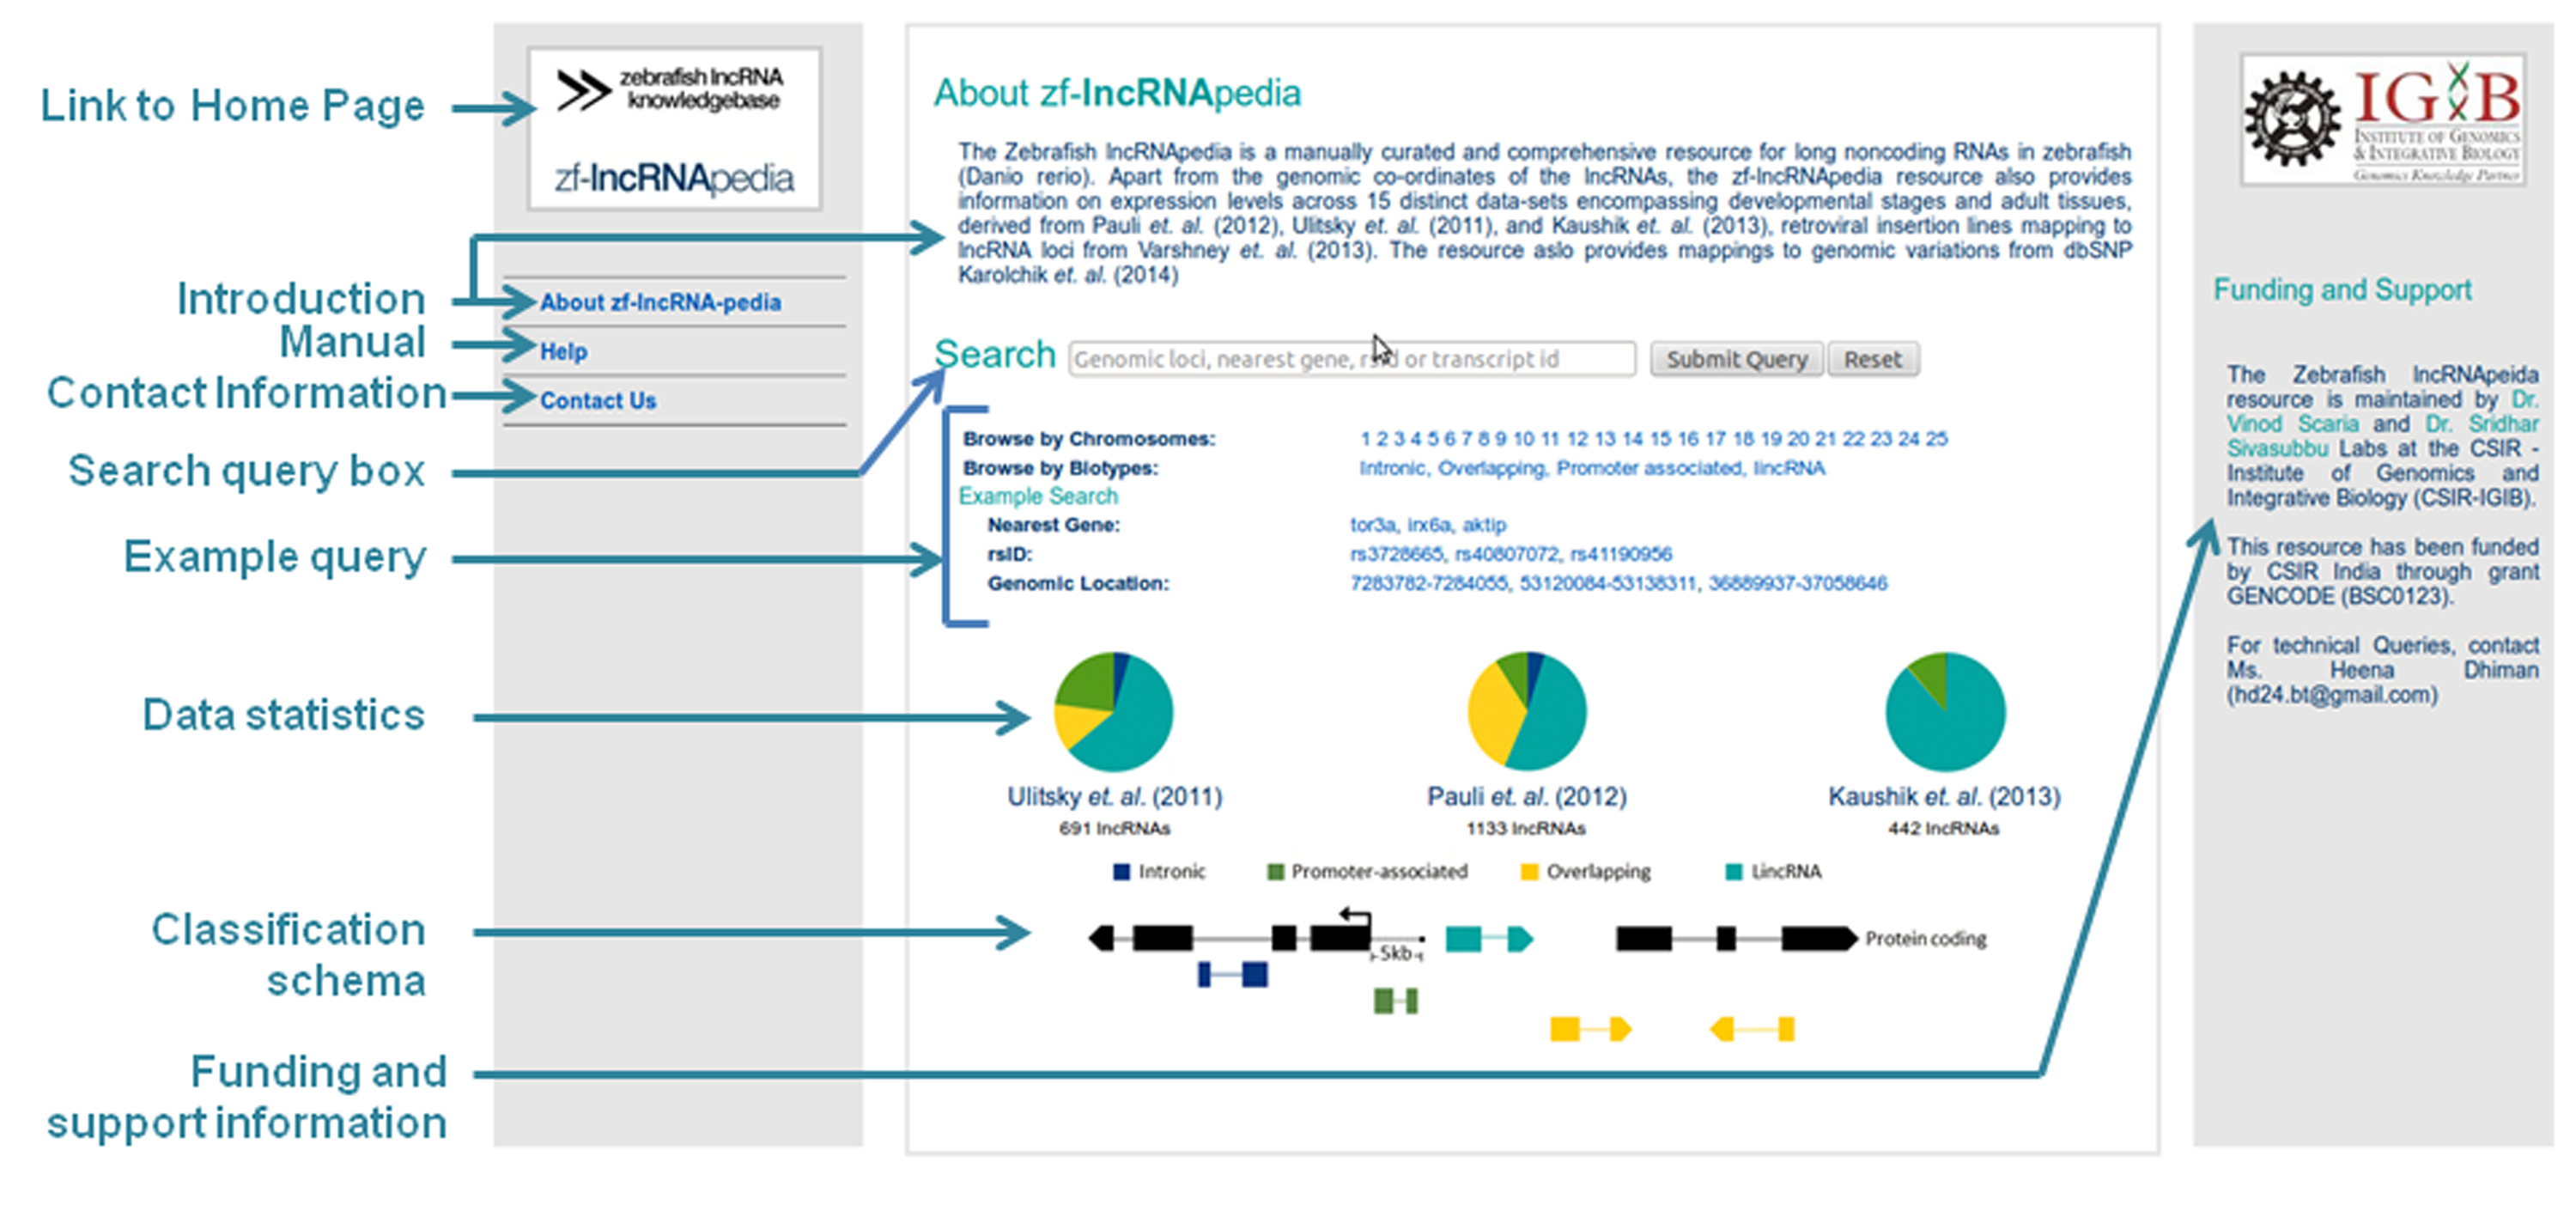
About zflncRNApedia
Home Page
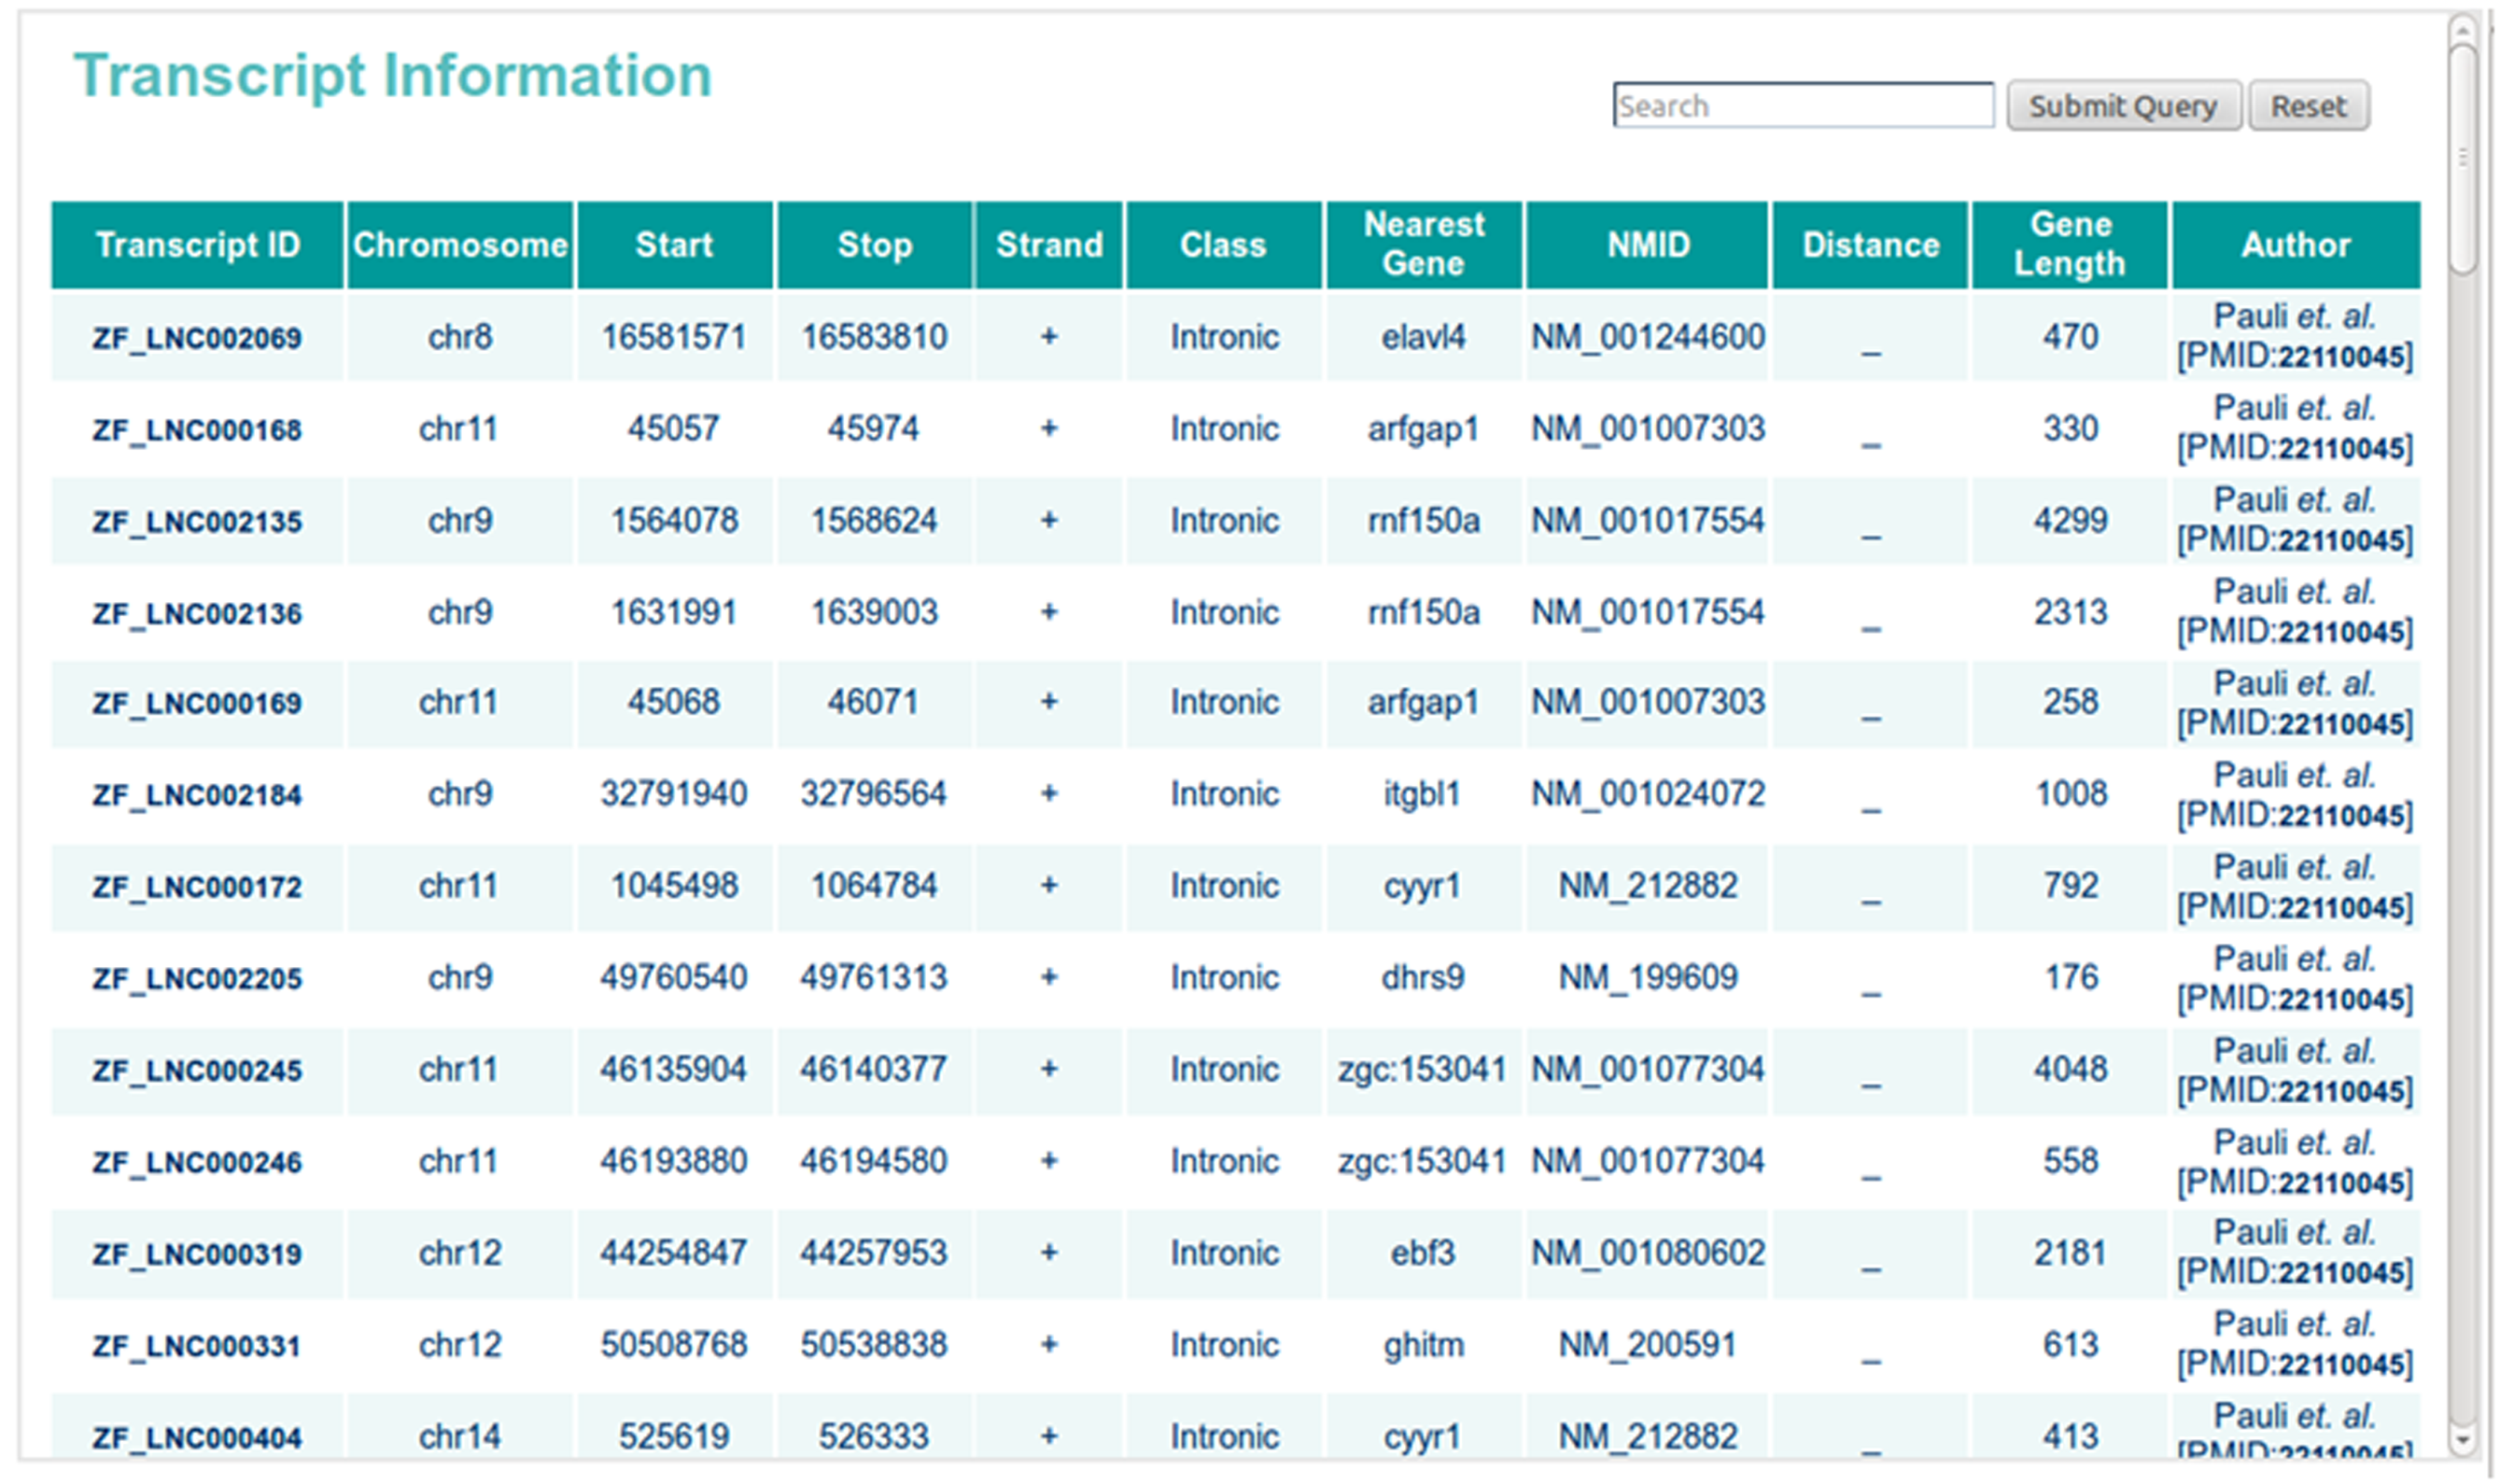
Search Result
Result Page
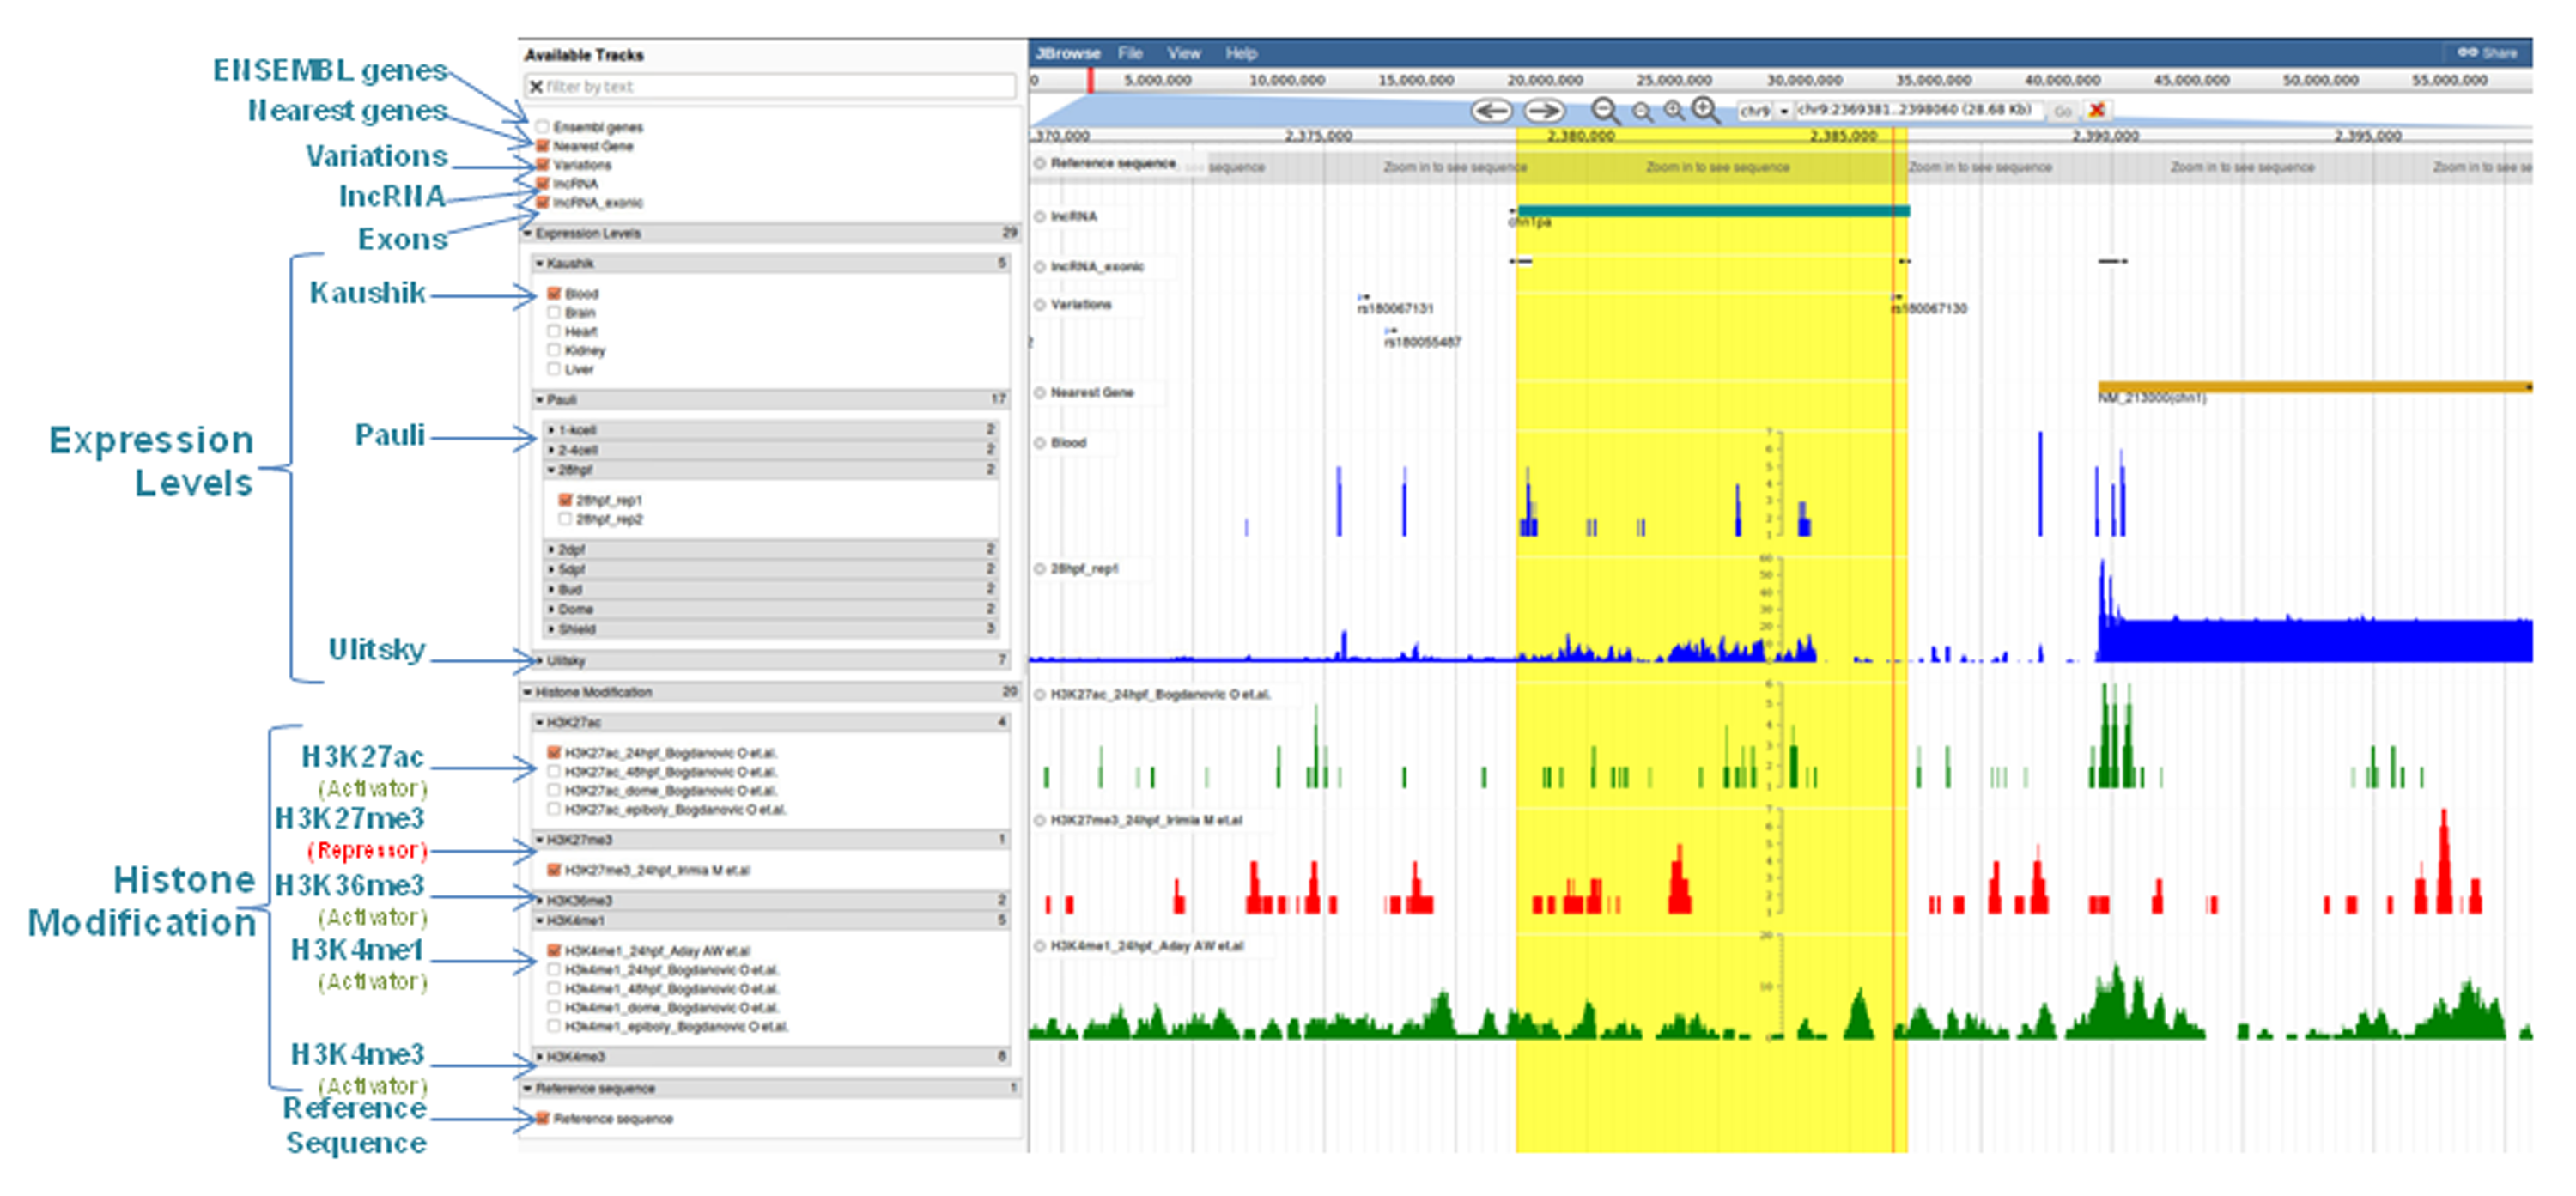
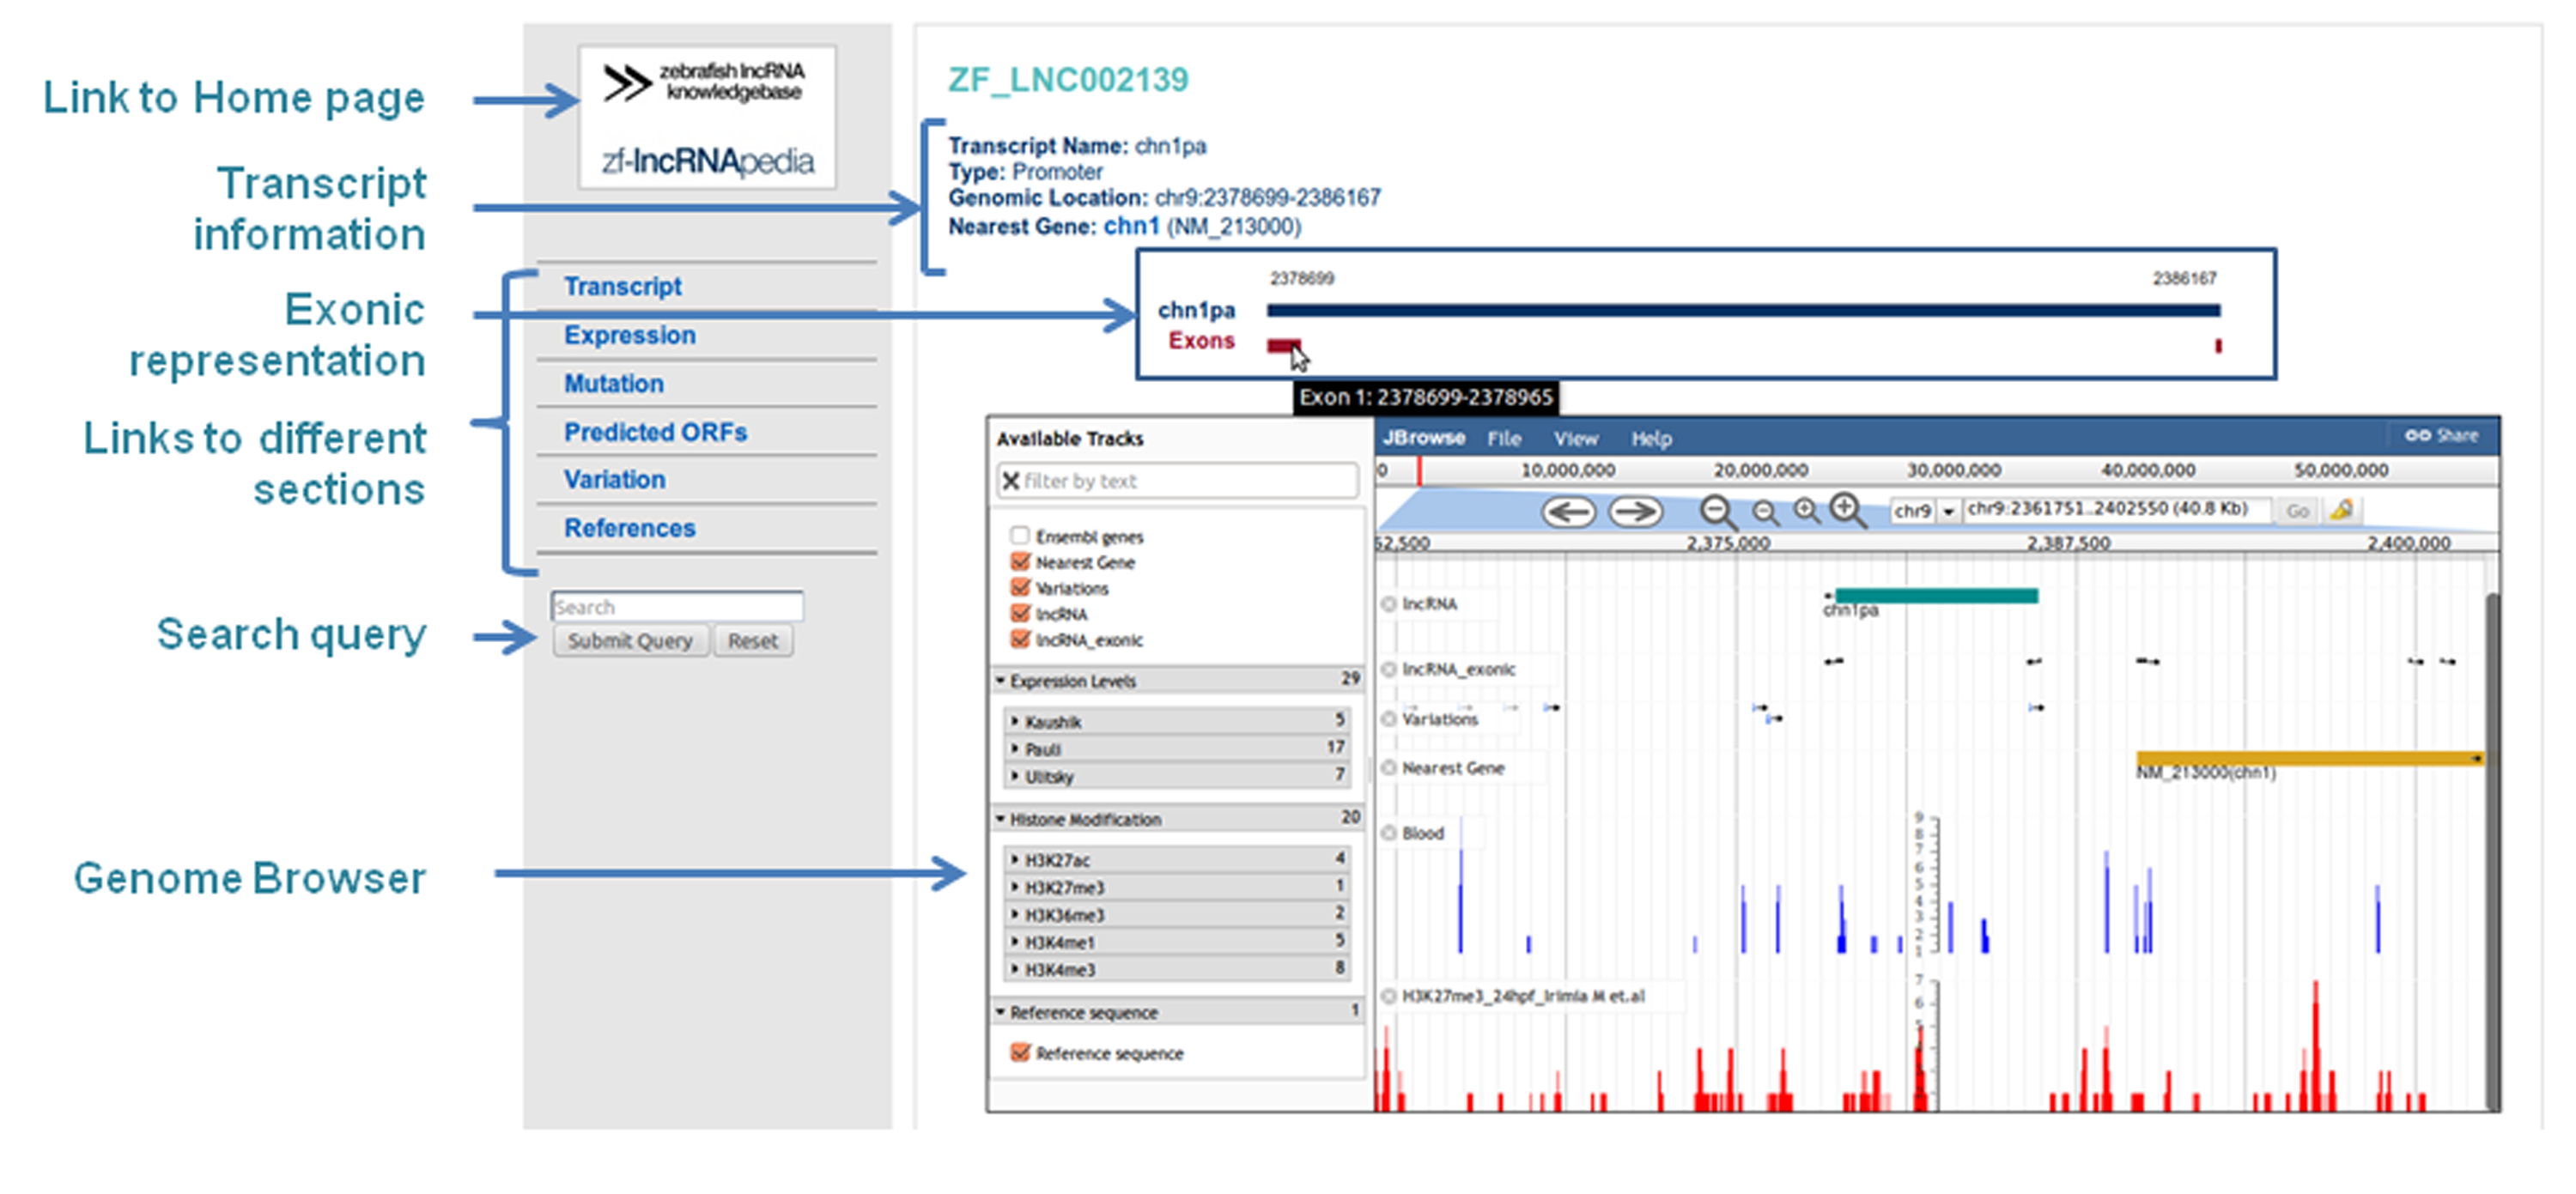
Genome Browser
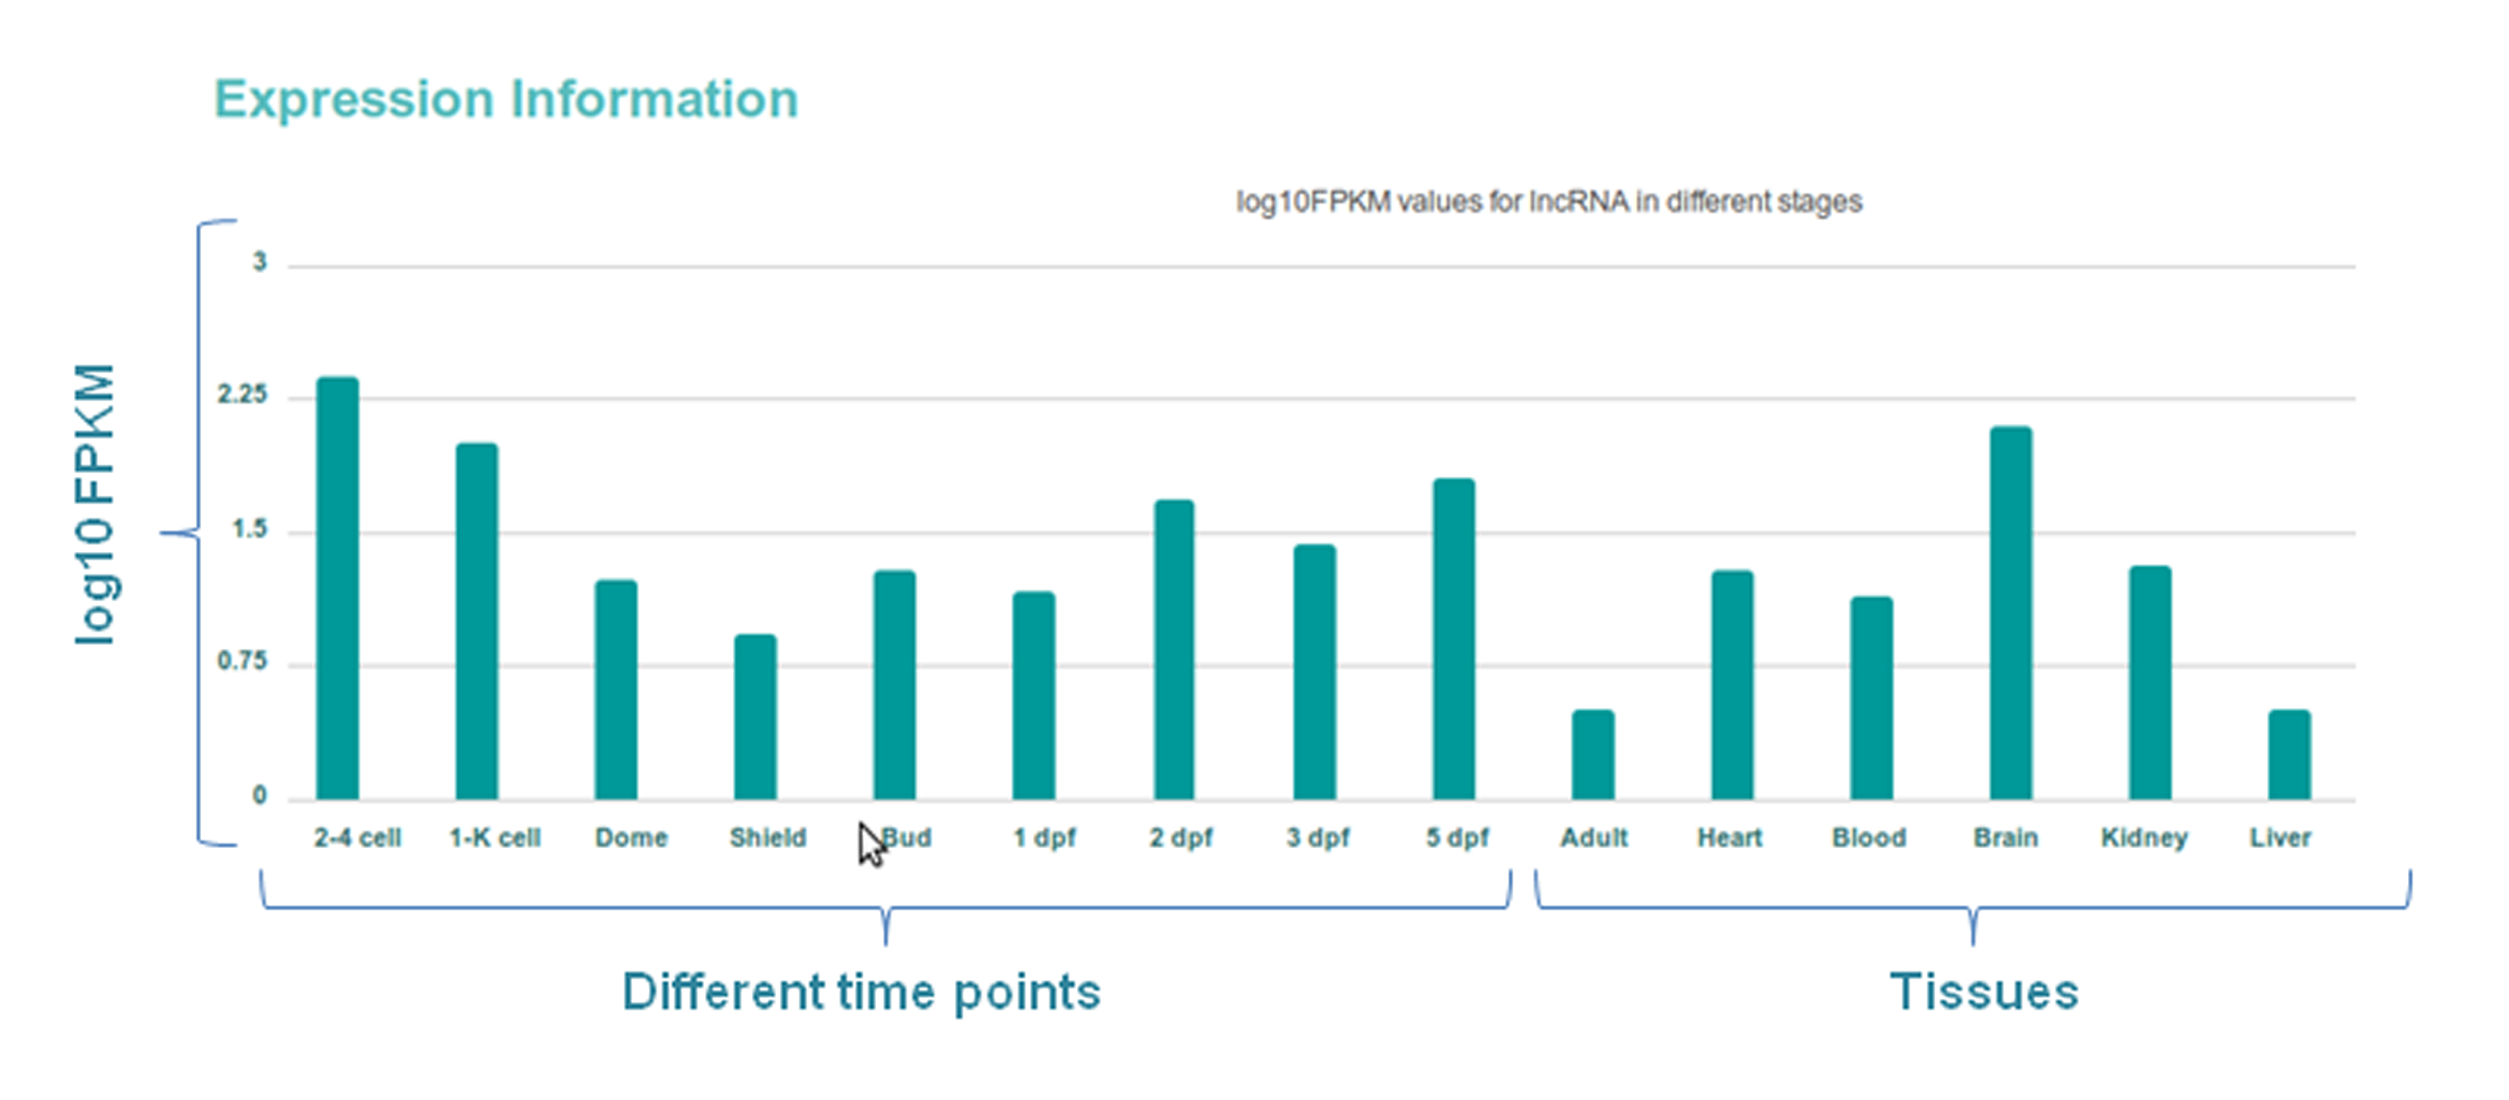
Expression Information
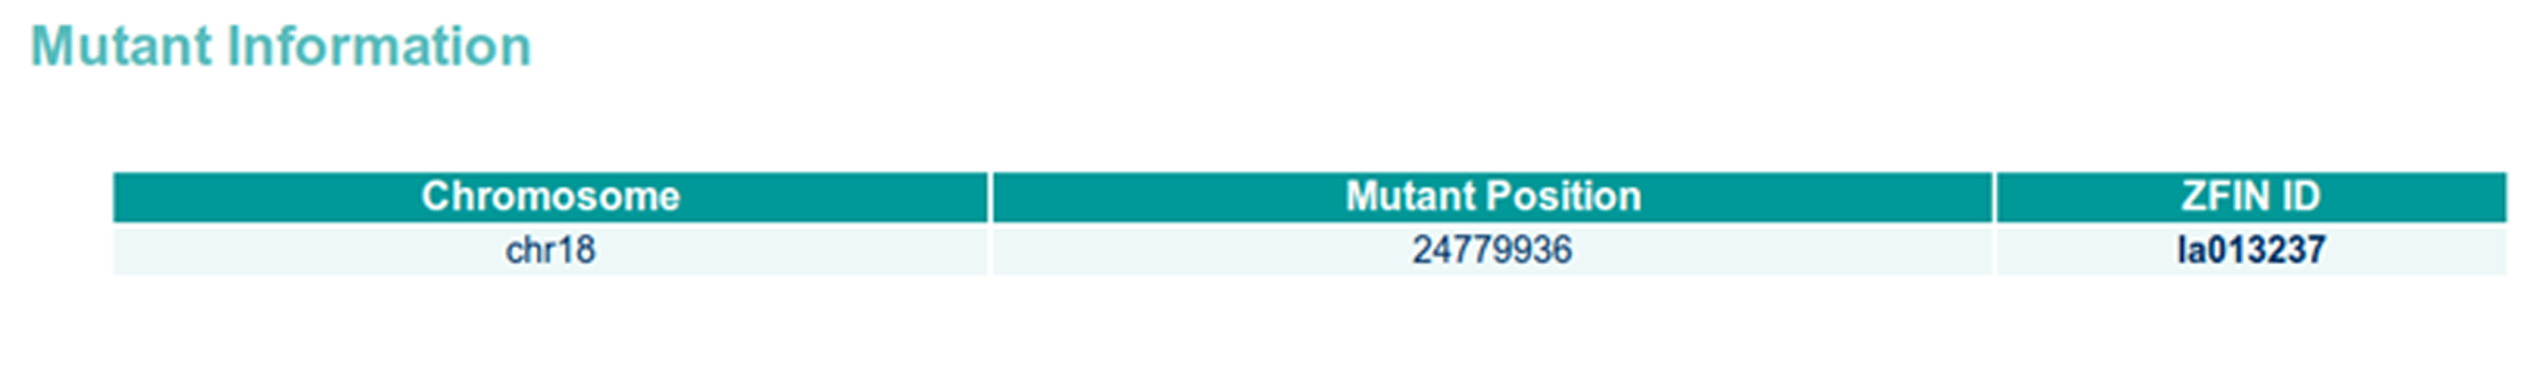
Mutation Information
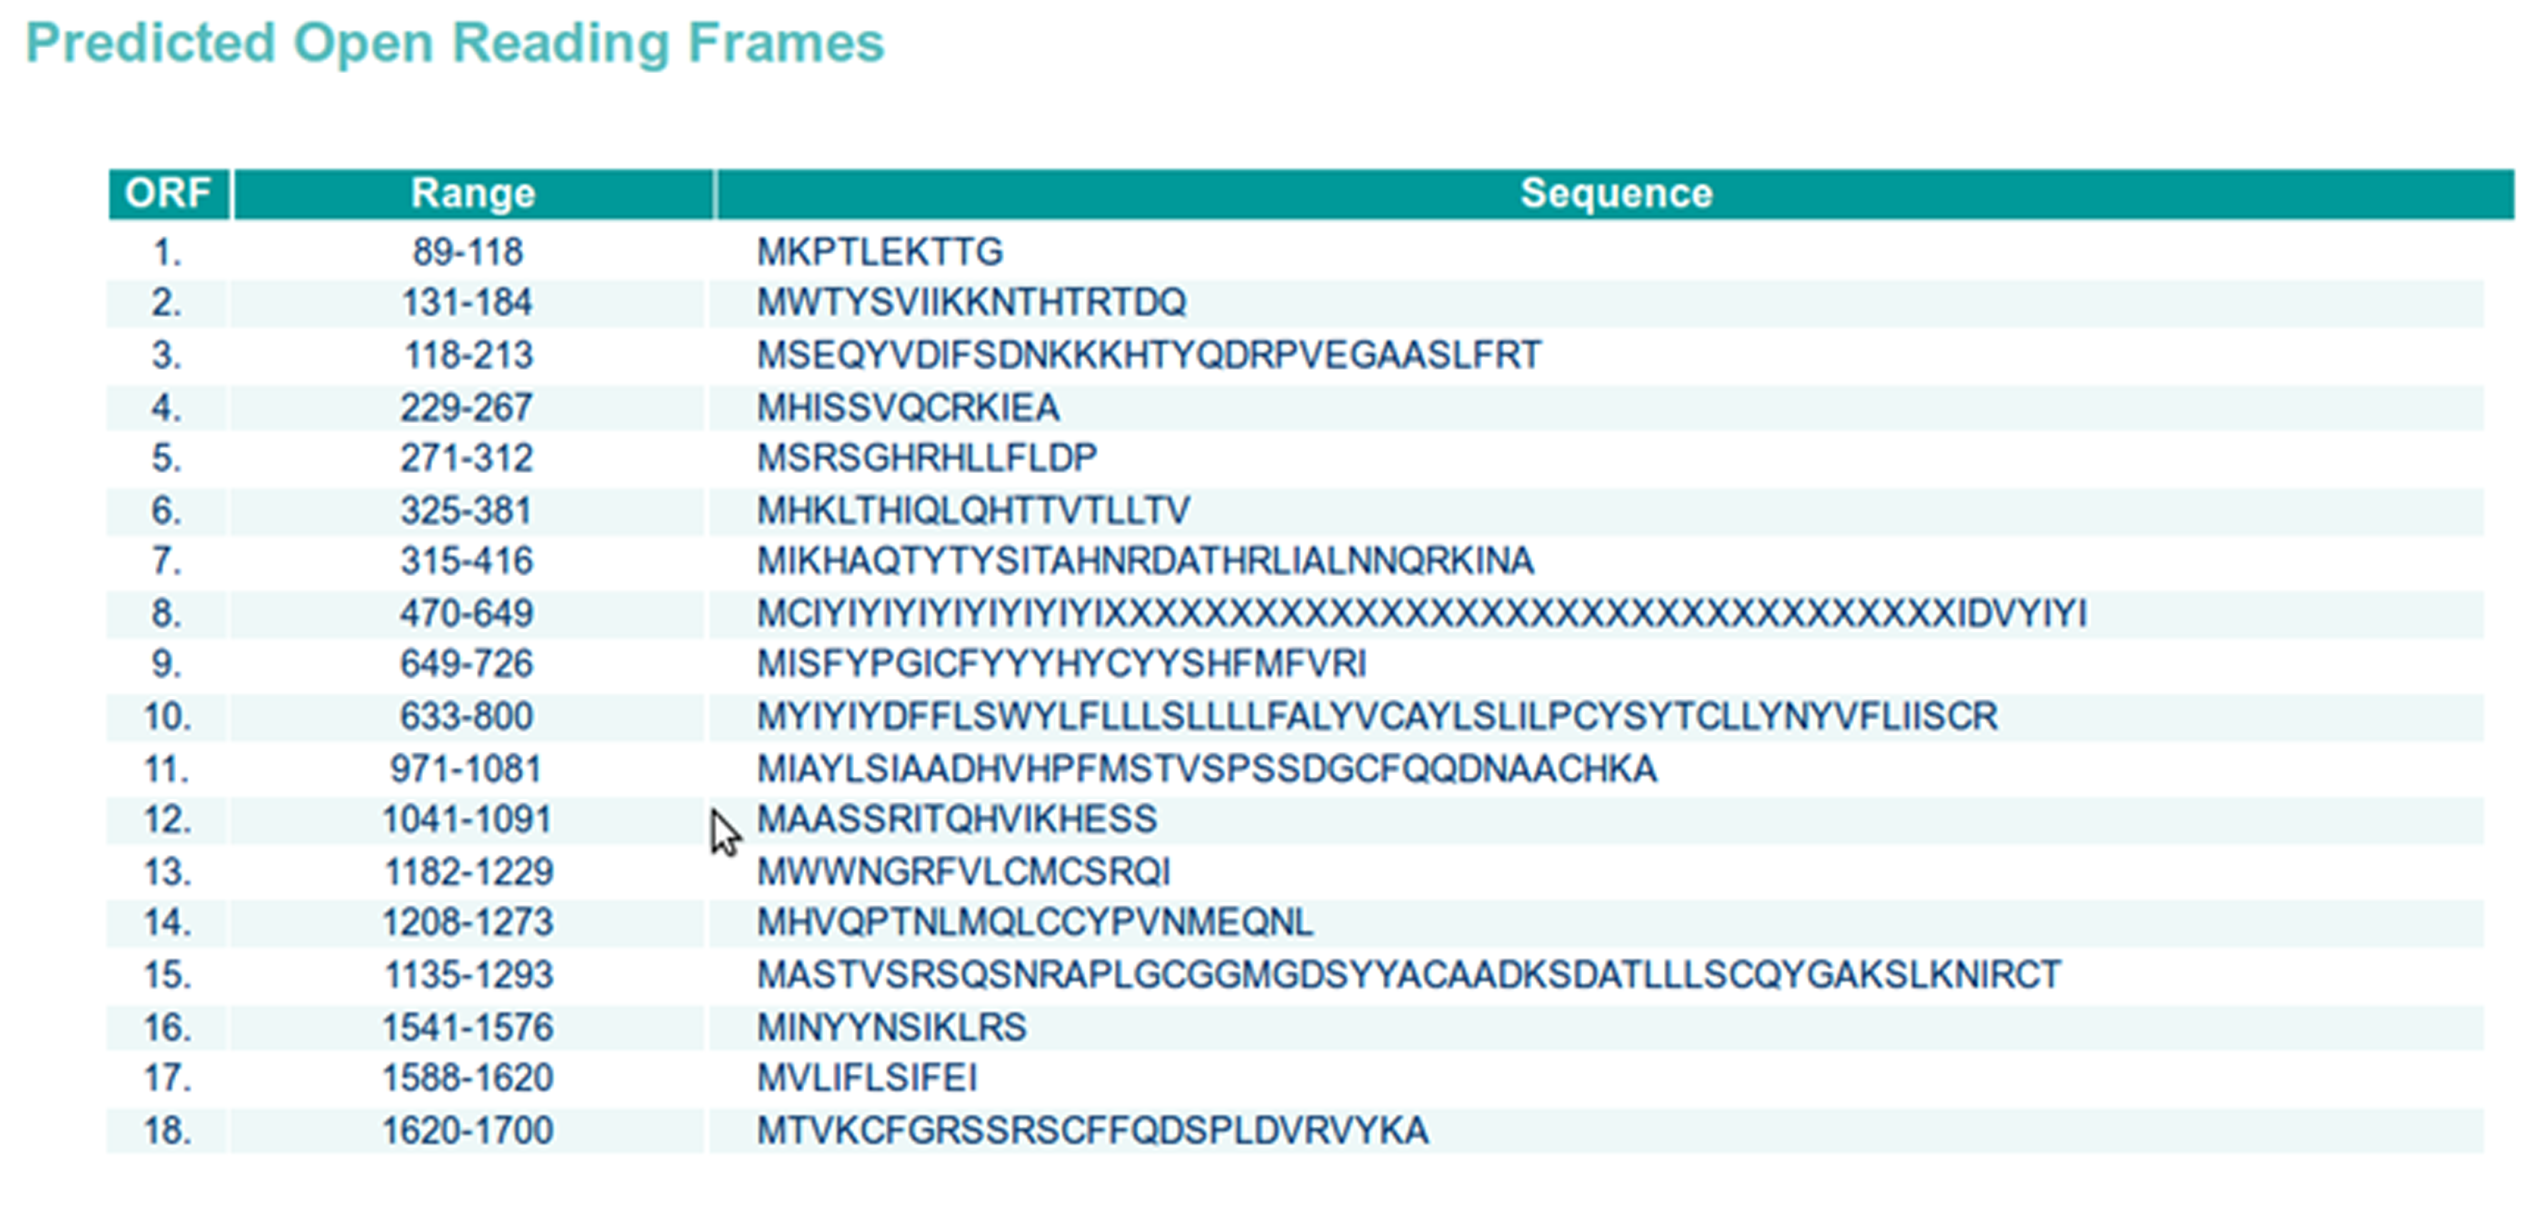
Predicted ORF
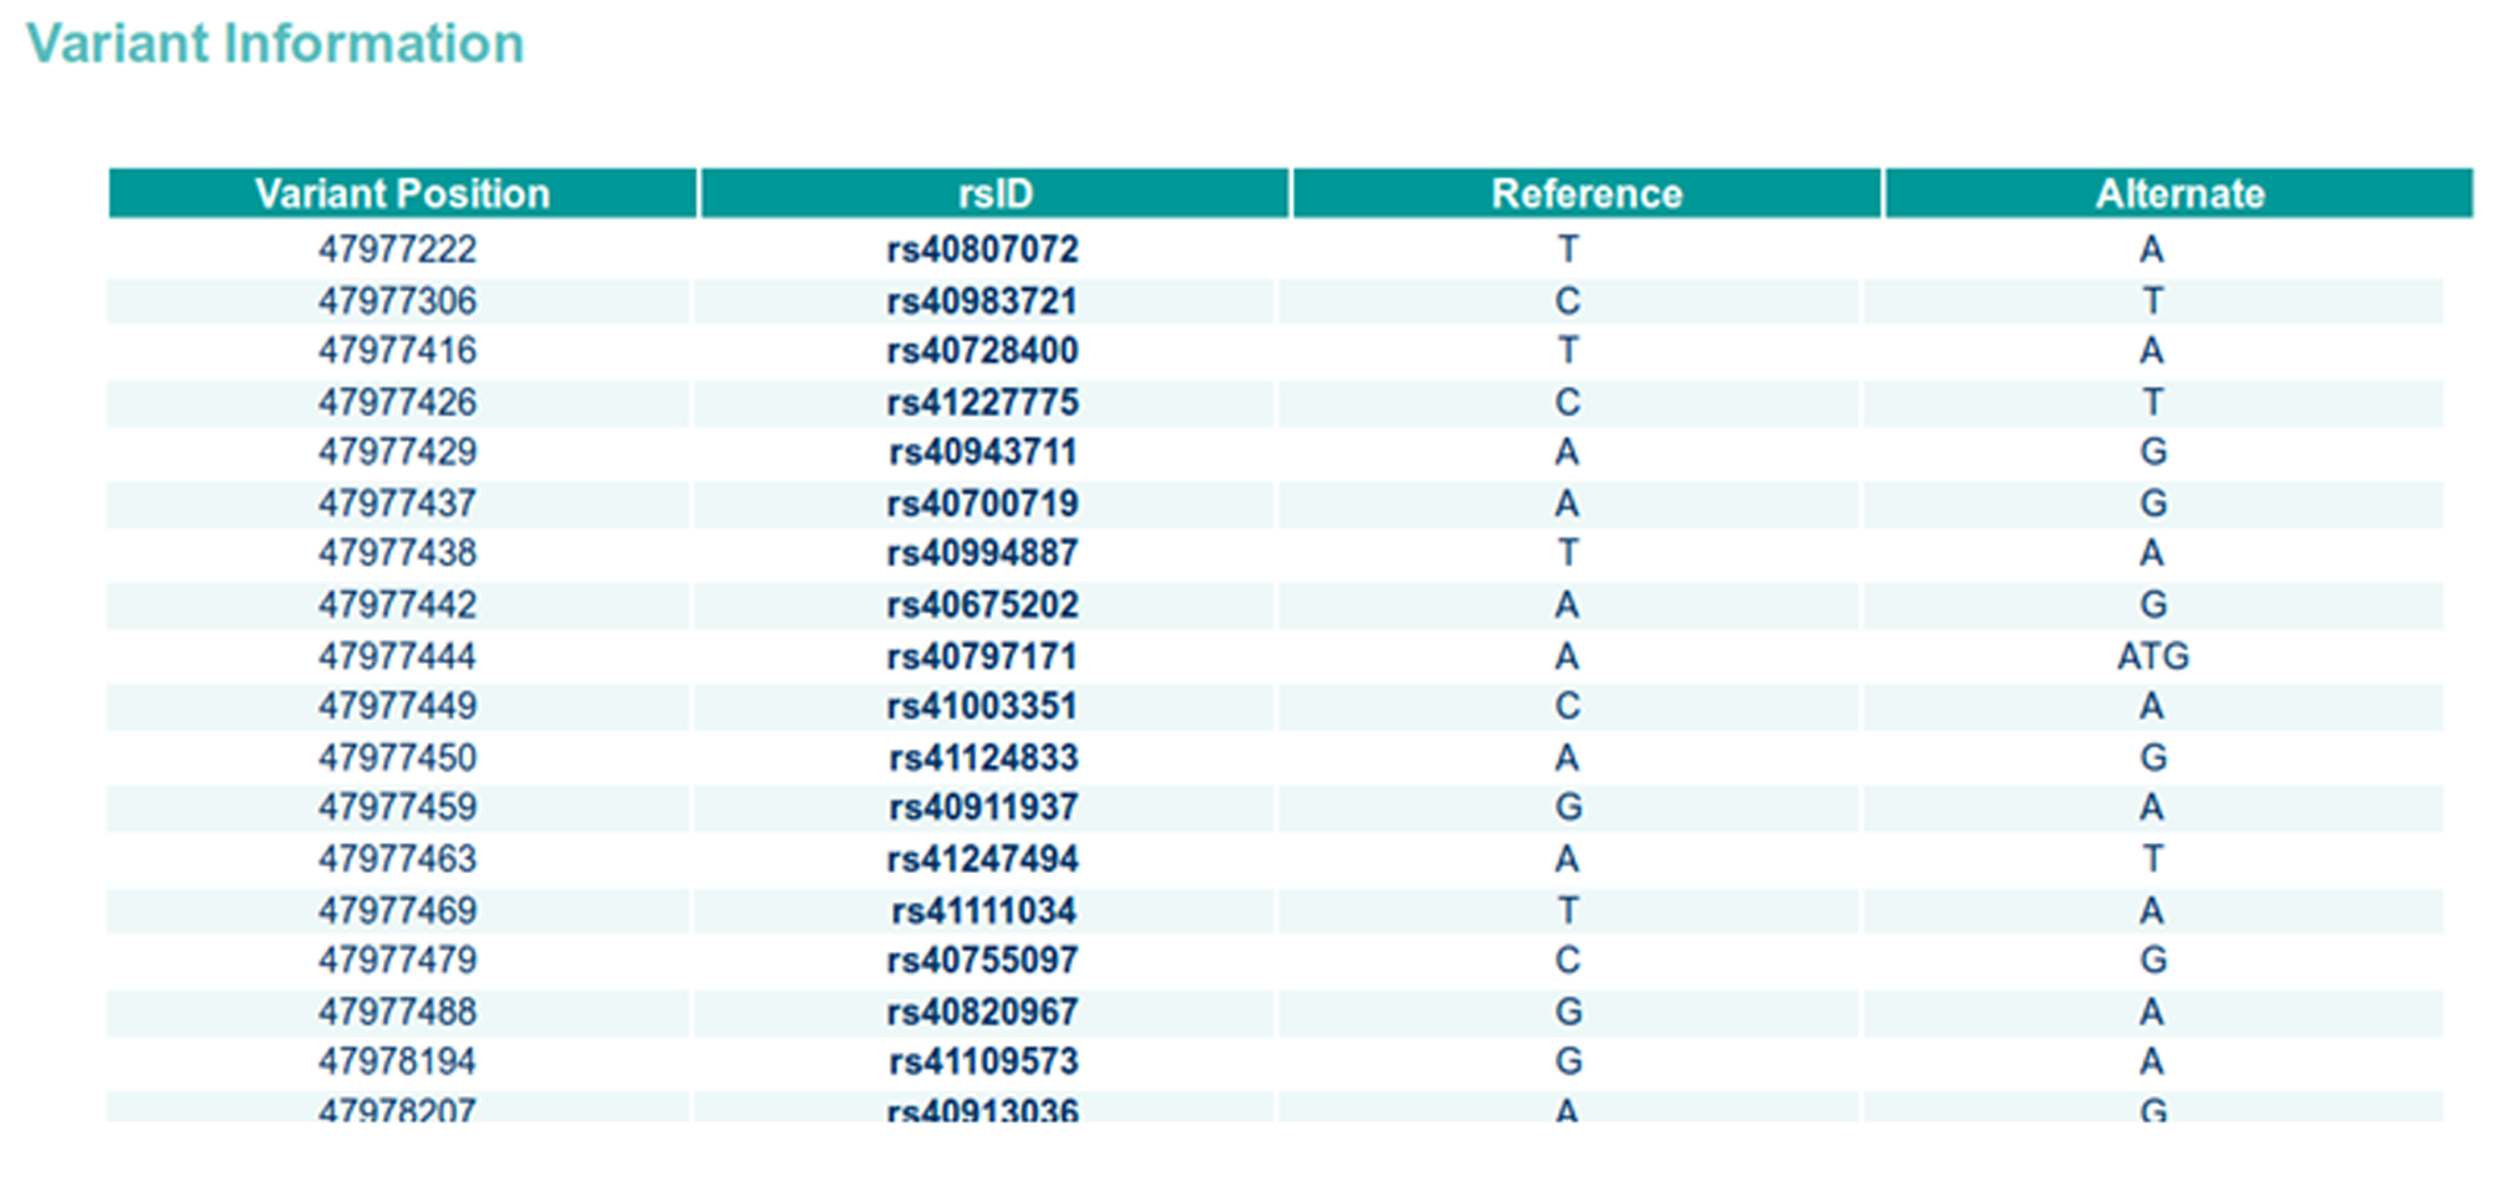
Variant Information
Contact Us

Funding and Support
| Transcript Description | Nonmenclature | Examples |
|---|---|---|
| Intronic transcripts | {Gene name}ia{numeral} | elavl4ia, arfgap1ia1, rnf150aia1 |
| Overlapping Transcripts | {Gene name}oa{numeral} | irx6aos1, irx6aos2, irx6aos3 |
| Promoter Associated Transcripts | {Gene name}pa{numeral} | chn1pa, si:dkey-281i8.1pa, dhrs9pa2 |
| lincRNA highly expressed in blood | rakt{numeral} | rakt1, rakt2, rakt3 |
| lincRNA highly expressed in brain | mstx{numeral} | mstx1, mstx2, mstx3 |
| lincRNA highly expressed in heart | hrid{numeral} | hrid1, hrid2, hrid3 |
| lincRNA highly expressed in kidney | vrkk{numeral} | vrkk1, vrkk2, vrkk3 |
| lincRNA highly expressed in liver | ykrt{numeral} | ykrt1, ykrt2, ykrt3 |
| lincRNA having negligible expression, no detectable expression or no specific expression pattern | lnc{numeral}_{Nearest gene name} | lnc_ccne1, lnc2_aktip, lnc2_psmc3 |
| lincRNA with no specific expression pattern and no nearest gene detected | lnc{numeral} | lnc1, lnc2, lnc3 |
| Type | Description | Example |
|---|---|---|
| Intronic | Transcripts that fall completely within the intron of a gene | ZF_LNC000319 |
| lincRNA | Transcripts found to be falling within two genes | ZF_LNC002002 |
| Overlapping | Transcripts having an overlap of atleast 1bp with a protein coding exon | ZF_LNC000167 |
| Promoter Associated | Transcripts having an overlap of atleast 1bp with the promoter 5kb upstream of the TSS of a protein coding gene | ZF_LNC002139 |
| 1. | Reference Sequence | The track reports the genomic sequence of Zebrafish | Reference sequence for Zv9 assembly reported by RefSeq is used. |
| 2. | lncRNA | The track represents 2,267 transcripts with the nonmenclature as described above. | Derived from the studies by Ulitsky et. al. (2011), Pauli et. al. (2012) and Kaushik et.al. (2013). |
| 3. | Exons | The track represents the exonic regions within the transcripts. | The exonic co-ordinates are used after merging the transcript information provided by the three studies taken into consideration using cuffmerge. |
| 4. | Nearest Gene | This track shows the gene nearest to each of the predicted lncRNA. | The information has been retrieved by parsing the ENSEMBL gene list for Zebrafish lncRNA to detect the coordinates of genes nearest to the predicted lncRNA. |
| 5. | Ensembl Genes | The track depicts the genomic location of all the genes reported for Zebrafish till date. | The ENSEMBL gene list for danRer7 Zv9 assembly has been used. |
| 6. | Variations | The track represents all the variations reported for Zebrafish till date. | The list of variations reported for Zebrafish in ENSEMBL release-76 has been used. |
| 7. | Expression Levels | 29 tracks from the three studies depict the corresponding stage specific or tissue specific expression. | Alignment maps were generated for the sequencing reads available from each stage specific or tissue specific sample provided by the three studies on SRA. |
| 8. | Histone Modification | 20 tracks depict the epigenetic regulation of transcripts by reporting the position of histone modification marks (H3K27ac, H3K27me3, H3K36me3, H3K4me1, and H3K4me3) predicted by different stage specific studies. | Chip-Seq data was retrieved from all the stage specific studies available on SRA. |