Pre-requisites
Raw sequencing reads: Mitochondrial DNA sequence data is stored in fastq format which reports nucleotide sequence with their Phred qualities in a single file. Command-line version is compatible with data having 51 bp of read length.
Reference genome: The analysis is based on alignment of sequencing reads with modified version of revised Cambridge Reference Genome Sequence (rCRSm) which can be downloaded from
http://genome.igib.res.in/mitomatic/
Alignment tool: MAQ, BWA or BOWTIE can be used for sequence alignment and variant calling. Pileup file summarizes the base calls of aligned reads to a reference sequence and is required to extract variations in the sample reads.
Command-line version: The script (mitomatic.pl) provided in the command-line version can be used either to run the complete computational pipeline or to parse the pileup file created by MAQ, BWA or BOWTIE. The parsed file is can be uploaded to mit-o-matic (http://genome.igib.res.in/mitomatic/) for further analysis.

Best Practice
FastQ quality analysis: Use
FastQC to analyse various parameters such as sequence quality, per base sequence content, sequence length distribution and presence of overrepresented sequences.
Adapter trimming: It is preferred to remove overrepresented sequences like adapters, PCR primers and other artifacts. Use
Trimmomatic to remove adapters and check the FastQC report again to confirm if all the overrepersented sequences have been removed.
Quality Trimming: Since quality of reads often degrades over the course of a sequnce, the low quality bases should also be removed. Average quality of 30 is usually considered good and can be set while running
trimmomatic as well. DynamicTrim script from
SolexQA tool can also be used for qulaity trimming.
Length Sort: After quality triming, it is preferred to separate high quality reads from low quality on a user-defined length cutoff. LengthSort script from
trimmomatic as well. DynamicTrim script from
SolexaQA tool can be used for length sort over the average sequence length identified by FastQC.
Alignment mismatch: While aligning the reads to the reference sequence, alignment mismatch count of 2 is considered to be standard.
Paired End: Using paired-end reads for the analysis improves results over using single-end reads.
Steps of Execution
Online version
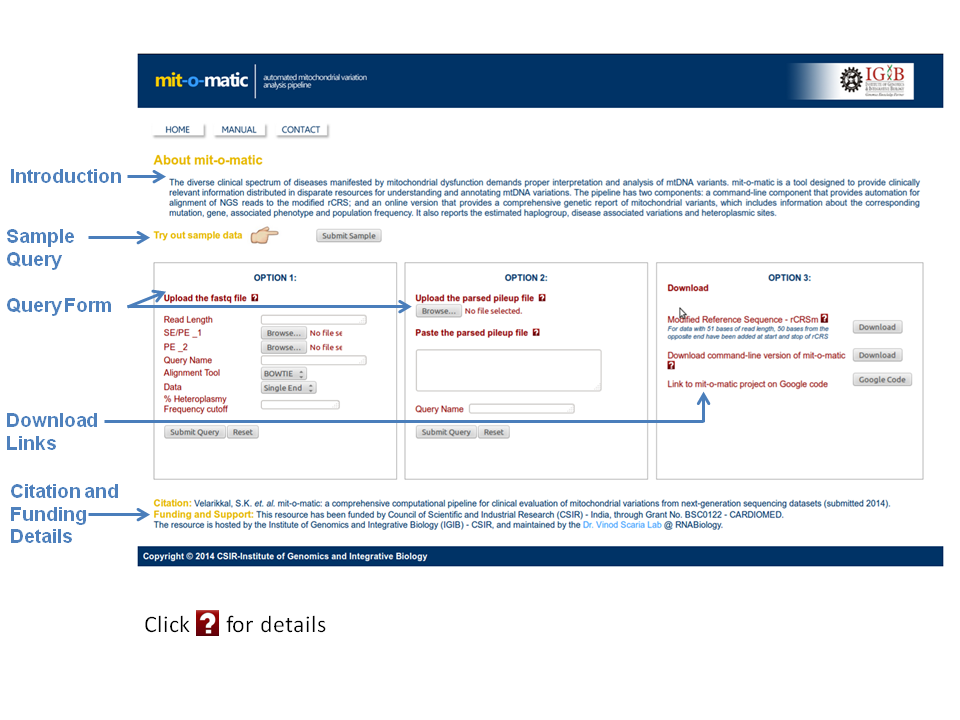
Home page of mit-o-matic provides a brief introduction about the tool, the query form and the download links.
Command-line version of mit-o-matic is available for download on the home page, to parse the pileup file and filter out variations based on heteroplasmic frequencies.
The user can either upload the fastq file (maximum coverage = 500x) or the
parsed pileup file to submit for the analysis of mitochondrial variations.
To get an idea about the report, a submit button has been provided to upload the sample file as well.
Command-line version
Command-line platform of mit-o-matic offers execution of the entire computational pipeline with a single command.
The script provided runs alignment of the sample reads on the modified reference genome (rCRSm) using the selected platform (MAQ, BWA or BOWTIE).
Pileup file generated is then parsed to extract and filter variations based on heteroplasmic frequencies.
Finally the
parsed pileup is submitted to http://genome.igib.res.in/mitomatic/ with LWP. This generates a sample report in the form of an html file (mito_out.html) in the output directory.
The user can use the same script to just parse an already created pileup and save it for future use for analysis of mitochondrial variations with mit-o-matic. Different heteroplasmic frequencies can be set depending on the depth of sample reads. Usually 10% heteroplasmic frequency is considered to be acceptable.
Untar the downloaded file: tar -xvzf mitomatic_command-line.tar.gz
Change directory: cd mitomatic_command-line
Complete pipeline
USAGE: perl mitomatic.pl -t [bowtie/bwa/maq] -o [se/pe] -f [Percentage of heteroplasmic frequency] -d [output directory] -i [input fastq files]
Parsing pileup
USAGE: perl mitomatic.pl -p [pileup file] -t [bowtie/bwa/maq] -f [Percentage of heteroplasmic frequency]
-t Tool to be used for the alignment from BWA, BOWTIE and MAQ
-o Type of data, whether single end or paired end
-f Percentage of heteroplasmic frequency to call the variants [Preferred: 10]
-d Name of the output directory
-I Input fastq file. In case of paired end data mention both the files one after other
-p For parsing an already generated pileup
-n For just parsing the pileup file, mention the output filename after -n. By default the output is saved in parsed_all.pileup.
-h Help
Examples for command line
1. Set default parameters: perl mitomatic.pl -c -i sample.fastq
Runs complete pipeline with default parameters: alignment using
maq, assuming data as
single end, filtering variations with
10% hetereoplasmic frequency. Output is stored in folder named
mitomatic_out.
2. Change the alignment tool: perl mitomatic.pl -c -i sample.fastq -t bwa
Runs complete pipeline using
bwa for alignment, assuming data as
single end, filtering variations with
10% hetereoplasmic frequency. Output is stored in folder named
mitomatic_out.
To align with maq/bowtie, replace bwa with maq/bowtie.
3. Change the alignment tool and set frequency: perl mitomatic.pl -c -i sample.fastq -t bwa -f 5
Runs complete pipeline using
bwa for alignment, assuming data as
single end, filtering variations with
5% hetereoplasmic frequency. Output is stored in folder named
mitomatic_out. Set frequency after option -f.
4. Change name of the output directory: perl mitomatic.pl -c -i sample.fastq -d sample_maq
Runs complete pipeline using
maq for alignment, assuming data as
single end, filtering variations with
10% hetereoplasmic frequency. Output is stored in folder named
sample_maq.
5. For paired end data: perl mitomatic.pl -c -i sample_1.fastq sample_2.fastq -o pe
Runs complete pipeline using
maq for alignment considering
paired end data, filtering variations with
10% hetereoplasmic frequency. Output is stored in folder named
mitomatic_out. In case
-o pe option is not given, only the first file is considered for alignment, ignoring the second file.
6. For parsing already prepared pileup file: perl mitomatic.pl -p all.pileup -t bwa
Filters variations with
10% heteroplasmic frequency from the pileup created by
bwa and prepares a file
parsed_all.pileup compatible with mit-o-matic online version.
-t option is mandatory while parsing pileup.
7. For parsing already prepared pileup file with a defined frequency: perl mitomatic.pl -p all.pileup -t maq -f 5
Filters variations with
5% heteroplasmic frequency from the pileup created by
maq and prepares a file
parsed_all.pileup compatible with mit-o-matic online version.
mit-o-matic Output:
Report Summary:
The tool summarizes the report of analysis on top of the output page. Herein, the reference genome being used, the haplogroup corresponding to the input variants and counts of some significant characteristics of the report are described. This includes:
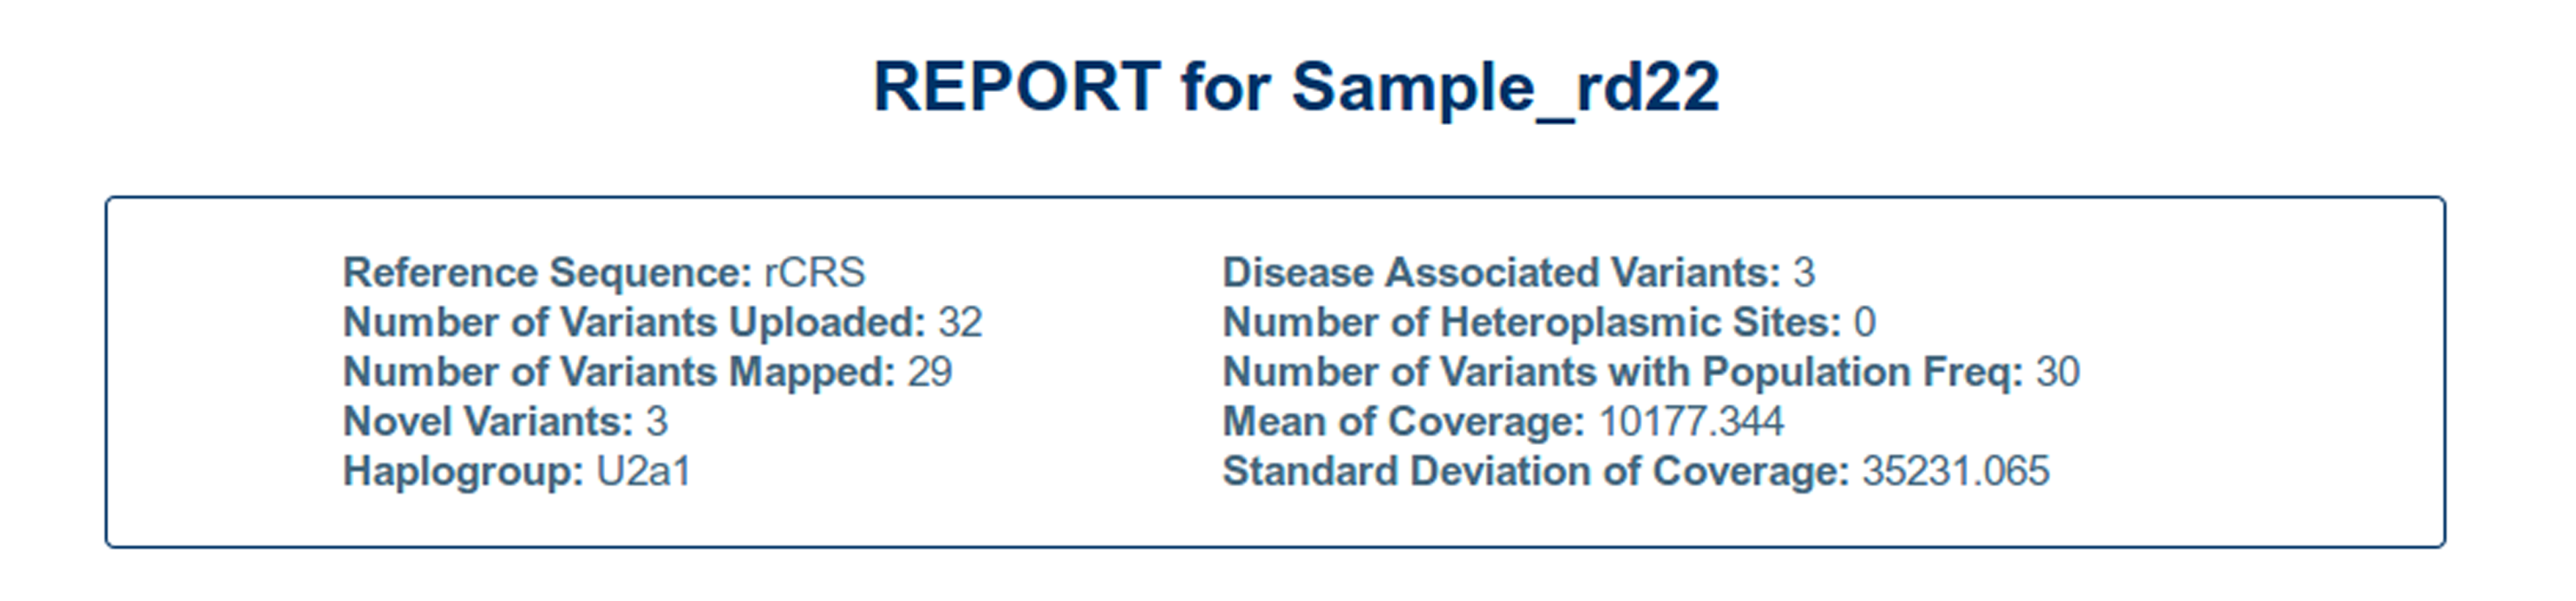
| Reference sequence: | Reference genome that has been used for analysis |
| Number of Variants Uploaded: | Count of the variants that have been uploaded by the user |
| Number of Variants Mapped: | Count of the variants that have already been reported in the widely used databases that include mitomap and mtDB. |
| Novel Variants: | The variants that have not been reported as of now in the available databases are considered to be novel. |
| Haplogroup: | It reports the haplogroup to which the uploaded variants belong. This is deciphered from the haplogroup table compiled from the comprehensive phylogenetic tree of global human mitochondrial DNA variation (available at http://www.phylotree.org/builds/mtDNA_tree_Build_15.zip). The haplogroup having the highest number of variants matching to the input variants is reported. |
| Disease Associated Variants: | Number of variants that have been reported to have association with some mitochondrial disease by mitomap (available at http://www.mitomap.org/bin/view.pl/MITOMAP/MutationsCodingControl) |
| Number of Heteroplasmic Sites: | Number of times multiple mutations co-exist in various proportions (>10%) within the mitochondrial DNA. |
| Number of Variants with Population Frequency: | It reports the count of variants for which population frequency could be found. |
Below the report summary three different panels give section-wise information regarding annotation of individual variation.
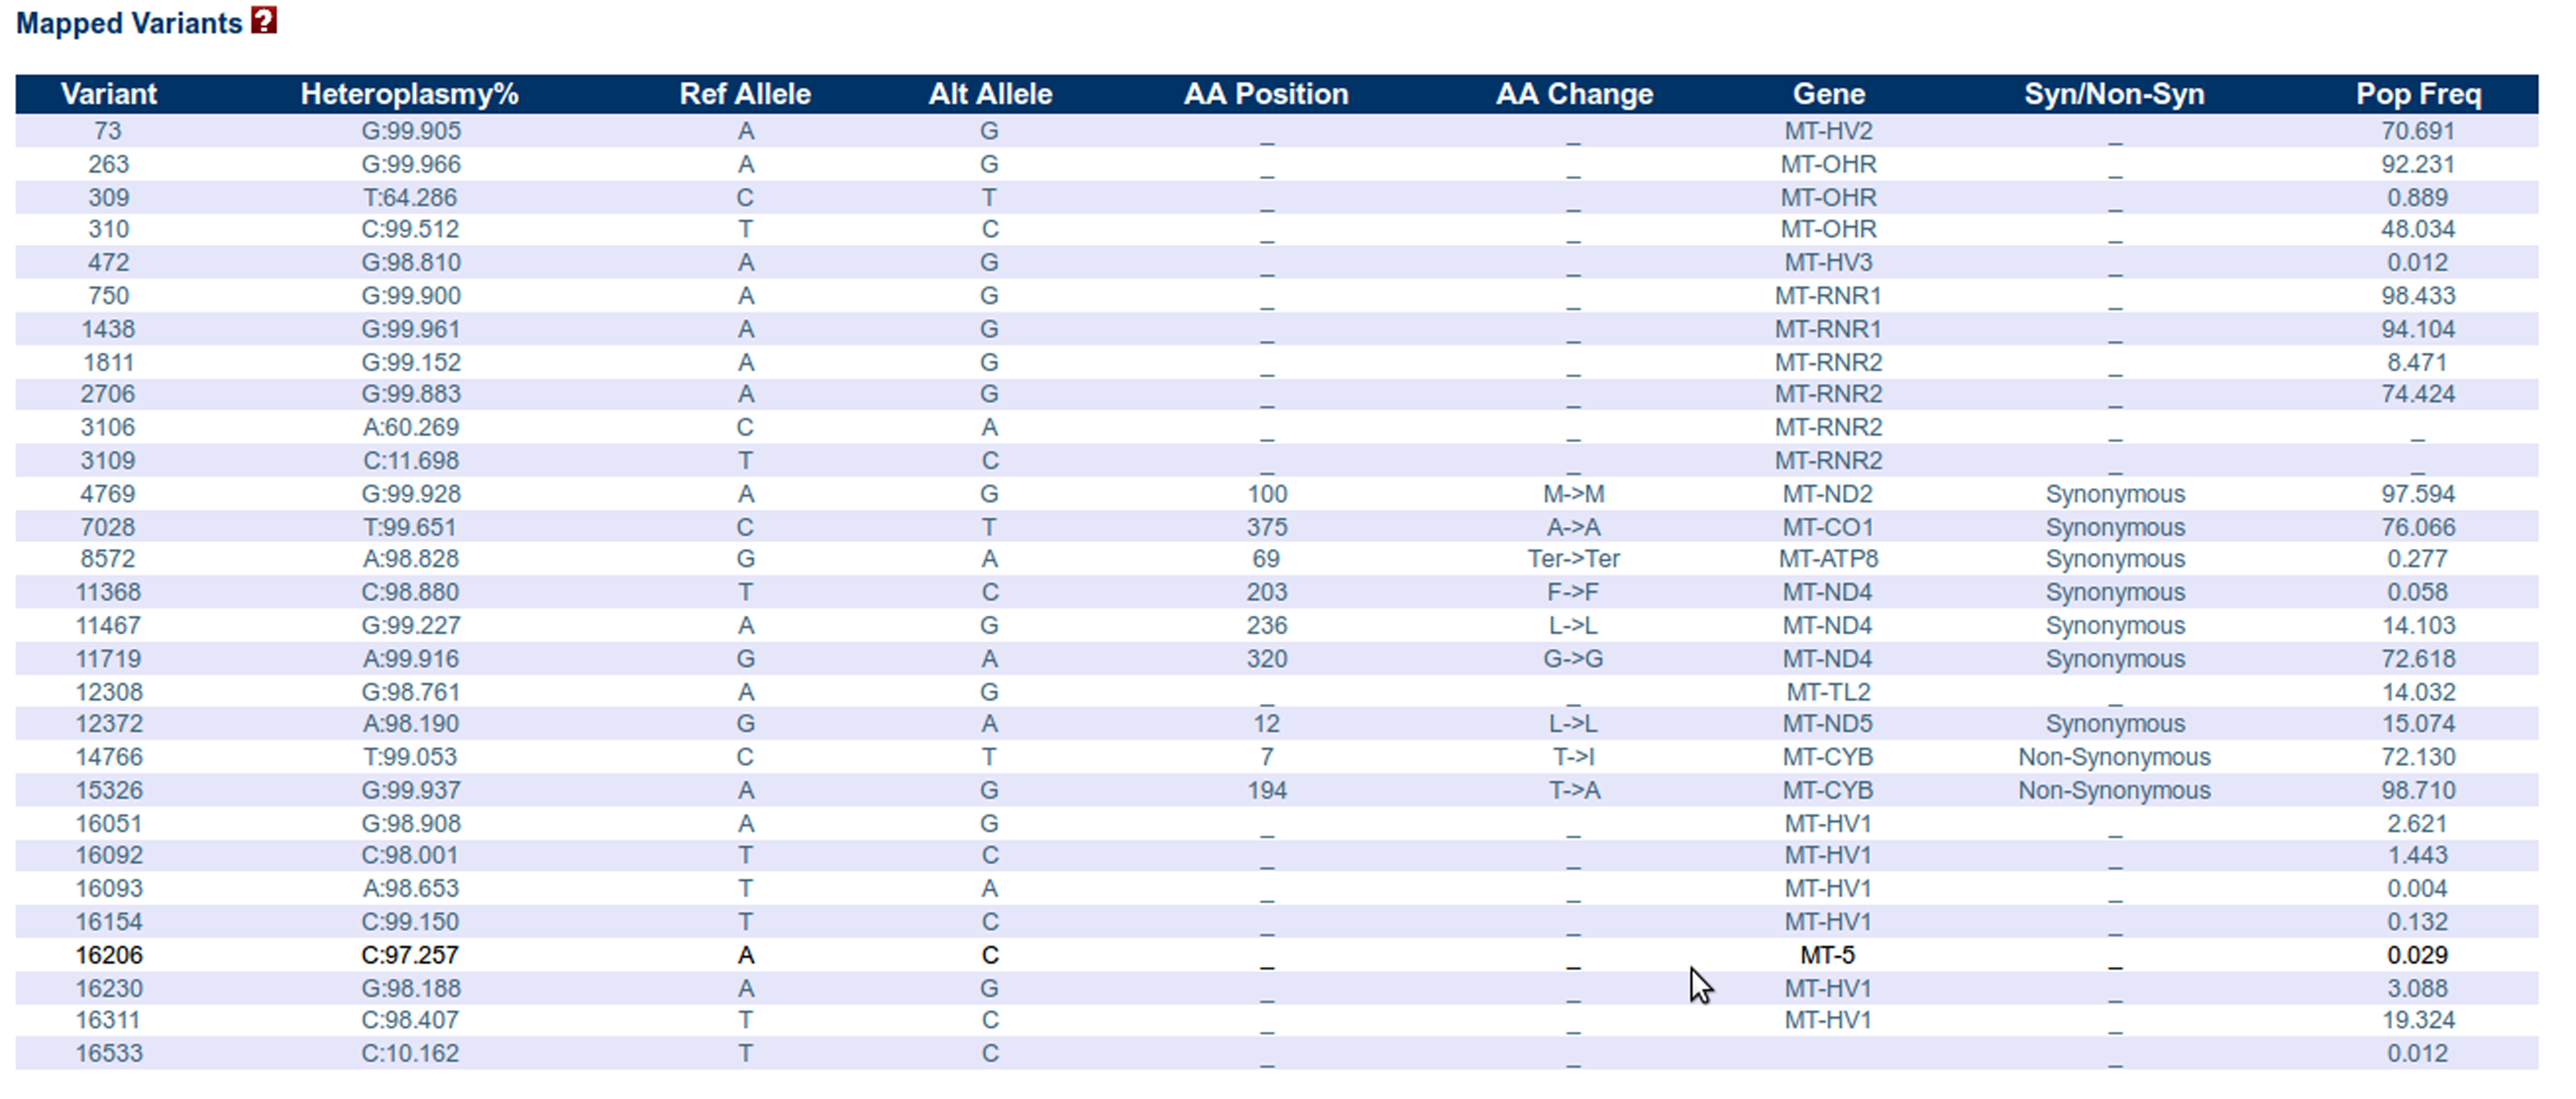
Certain parameters common to each panel include variant position, heteroplasmy percentage, reference allele, alternate allele, amino acid change corresponding to mutation, gene within which the variant position falls, type of mutation and population frequency for the variant.
In case more than one mutations co-exist in various proportions (>10%) within the mitochondrial DNA, the site is considered to be heteroplasmic and is marked with a * sign.
Nucleotides for which Heteroplasmy percentage is greater than 10% are considered to be the alternate alleles and are reported along with the corresponding percentage in the second column.
Heteroplasmy percentage = (Number of A/T/G/C x 100)/Total Number of Reads
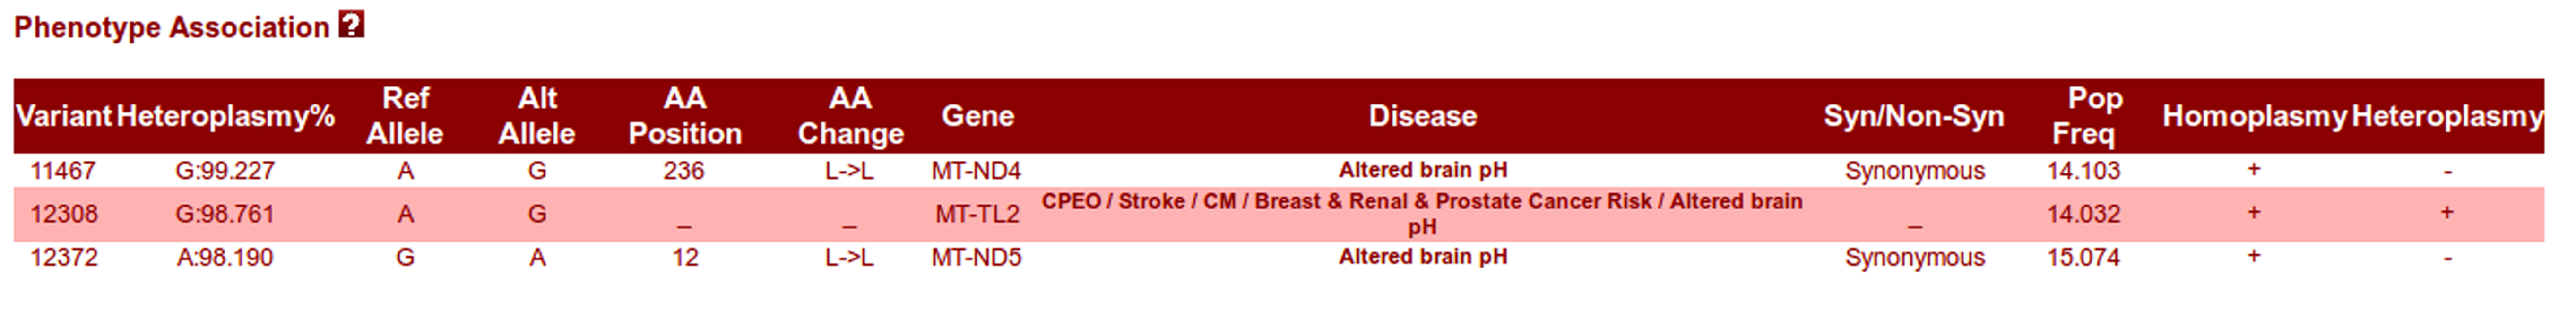
Description of column names:
| Column Name | Description |
|---|
| Variant | Variant Position |
| Heteroplasmy % | Percentage of heteroplasmic frequency |
| Ref Allele | Reference Allele |
| Alt Allele | Alternate Allele |
| AA Position | Amino Acid Position |
| AA Change | Change in Amino Acid |
| Gene | Mitochondrial DNA Function Location (Gene Loci) |
| Disease | Associated Disease |
| Syn/Non-Syn | Type of mutation - Synonymous or Non - Synonymous |
| Pop Freq | Population Frequency |
| Homoplasmy | '+' If Homoplasmic at variant position |
| Heteroplasmy | '+' If Heteroplasmic at variant position |
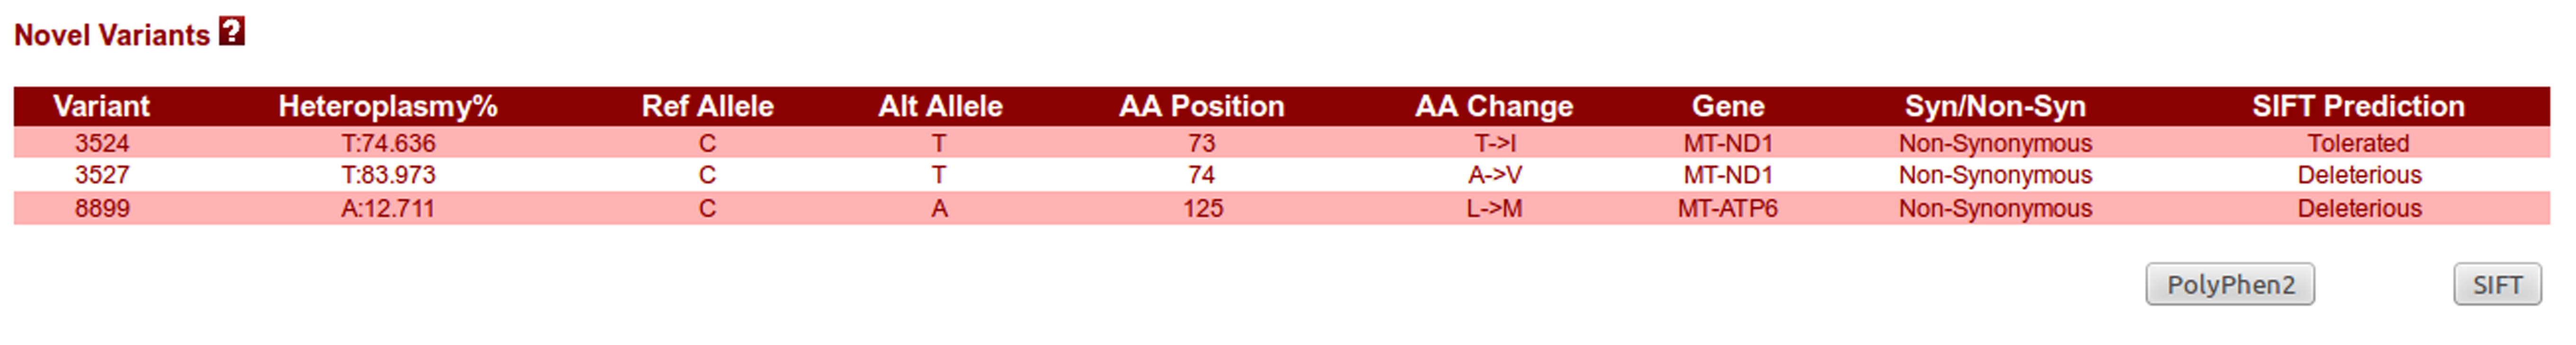
| SIFT Prediction | Whether the non-synonymous mutation is Tolerated or Deleterious |
Phenotype Association panel:
All the variations that are associated with phenotype and thus have disease association are reported under this panel. 8th column reports the corresponding disease that might be seen in case of variation at that particular position.
Novel Variants panel:
All the variations that are not reported in any other database as of now are considered to be novel and their corresponding information is shown within this panel. SIFT annotations are provided for the non-synonymous novel variants to analyze the effect of amino acid substitution on the protein function based upon structural change in protein.
Mapped Variants panel:
This panel enlists information regarding those variations that have already been reported in any of the existing databases. Position 3107, represented by an "N" is the error nucleotide in the original CRS that is maintained in the revised sequence as a gap. This error position shall always be detected as one of the heteroplasmic sites.


.jpg)
.jpg)
.jpg)
.jpg)
.jpg)